Plastic Pollution Calculator
Regional Plastic Pollution Estimator
Calculate how much plastic from your region enters the ocean based on production and waste management data.
How This Works: Based on data from the article, approximately 10% of mismanaged plastic waste reaches the ocean. The calculation uses: (Plastic Production × Mismanaged Waste Percentage) ÷ 1000.
Estimated Ocean Input
Every year, millions of tonnes of waste slip into the sea, but pinning down who’s actually responsible isn’t as simple as pointing at a single group. Below we break down the main players, the pathways they use, and what can be done to stop the flow.
Key Takeaways
- Plastic manufacturing companies produce the bulk of the material that ends up in the ocean.
- Mismanaged waste, illegal dumping, and shipping losses are the top pathways.
- Single‑use items and microplastics make up the majority of marine debris.
- Strong regulation, better waste‑management systems, and consumer pressure can curb the problem.
Understanding plastic pollution is the accumulation of plastic debris in marine environments, harming wildlife, ecosystems, and human health
From floating bottle caps to invisible micro‑fibers, plastic pollution affects every corner of the ocean. Researchers estimate that about 8milliontonnes of plastic enter the sea each year-roughly the weight of 1.5million elephants. The bulk of that waste doesn’t magically appear at the shoreline; it follows a chain of production, consumption, and disposal that involves several actors.
The Role of plastic manufacturing companies is the creation of polymer resins and finished plastic products that eventually become waste
Global plastic production topped 400milliontonnes in 2024. The top three regions-Asia, Europe, and North America-account for over 80% of that output. Companies in these regions generate the raw material that later turns into single‑use packaging, consumer goods, and industrial components. While manufacturers themselves don’t dump plastic directly into the sea, they set the stage by flooding markets with cheap, disposable items that are often poorly managed after use.
Why single‑use plastics are a major culprit
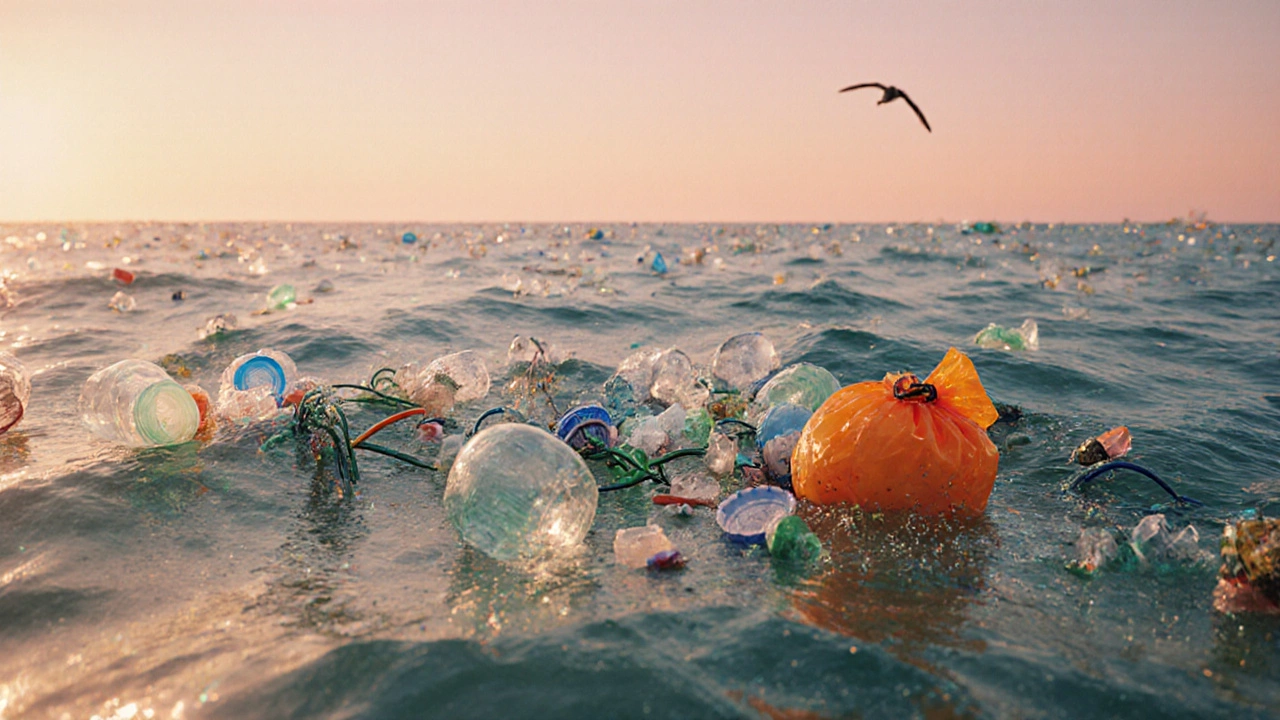
Items designed for one‑time use-like water bottles, straws, and grocery bags-make up about 60% of the plastic waste found on beaches. Their short lifespan means they’re quickly discarded, and many end up in litter bins that are either overflowed or improperly sealed. In developing nations, where waste‑collection infrastructure is weak, a large share of these items leaks directly into rivers that carry them to the ocean.
Microplastics: The Invisible Threat
When larger items break down, they form particles smaller than 5mm. These microplastics are tiny fragments that can be ingested by marine organisms and eventually make their way up the food chain. Even though they’re invisible to the naked eye, they’re now found in the guts of fish, seabirds, and even plankton-the foundation of marine ecosystems.
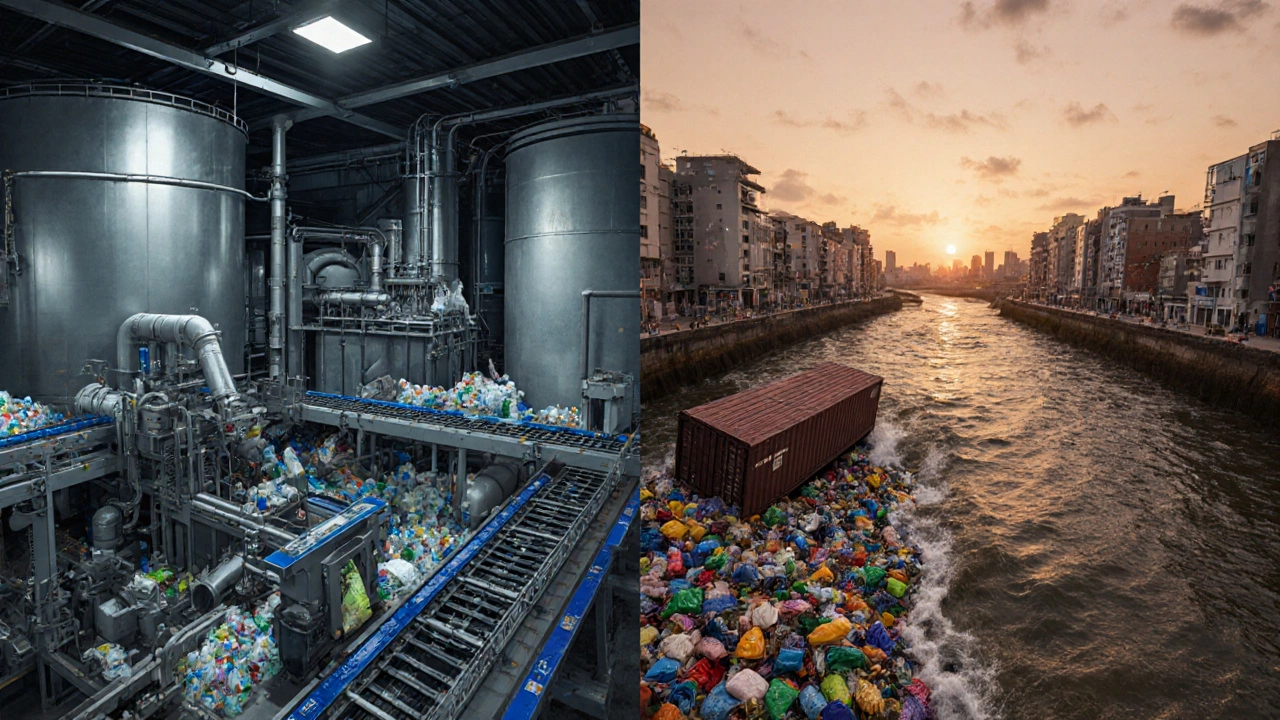
How Waste Management Gaps Turn Plastic into Ocean Trash
Even the best‑designed products can become marine litter if the downstream waste system fails. In many coastal cities, collection rates hover around 50%. The remaining waste either ends up in open dumps, is burned, or is illegally dumped. Illegal dumping is the unauthorized disposal of waste in rivers, canals, or open land, often to avoid fees is especially prevalent in regions with weak enforcement.
Shipping and Logistics: Accidents on the High Seas
Every year, thousands of containers are lost at sea due to storms, collisions, or improper stowage. These containers often carry plastic goods, pallets, and packaging. Once a container sinks or washes ashore, its contents fragment, adding directly to marine debris. The shipping and logistics industry contributes approximately 2-3% of total ocean plastic through lost cargo and discarded packaging, a figure that’s growing with global trade volume.
Fishing Gear: Ghost Nets and Plastic Line
Abandoned, lost, or discarded fishing gear-known as “ghost gear”-accounts for roughly 10% of all ocean plastic. Nets, lines, and traps are often made from durable polymers that don’t degrade quickly. When they’re left behind, they continue to trap marine life, a phenomenon called “ghost fishing.” This sector intersects with both plastic manufacturers (who supply the gear) and fishery operators.
Regional Comparison of Plastic Production and Mismanagement
| Region | Production (million tonnes) | % of Global Production | Mismanaged Waste % | Estimated Ocean Input (million tonnes) |
|---|---|---|---|---|
| Asia | 210 | 52 | 23 | 5.0 |
| Europe | 80 | 20 | 10 | 0.8 |
| North America | 73 | 18 | 7 | 0.5 |
The table shows that while Asia produces the most plastic, it also has the highest share of mismanaged waste, making it the largest single source of ocean‑bound debris.
Who Can Be Held Accountable?
Responsibility is shared across the value chain:
- Manufacturers must design for recyclability, reduce single‑use items, and support extended‑producer‑responsibility (EPR) schemes.
- Governments need stricter waste‑management regulations, better collection infrastructure, and enforcement against illegal dumping.
- Logistics providers should improve container tracking and seal integrity to minimize loss.
- Fishing companies must adopt biodegradable gear and participate in retrieval programs.
- Consumers can pressure brands, choose reusable alternatives, and properly dispose of plastics.
When any link breaks, the whole chain suffers, and the ocean pays the price.
What Can You Do Right Now?
- Support brands with clear commitments to reduce virgin plastic.
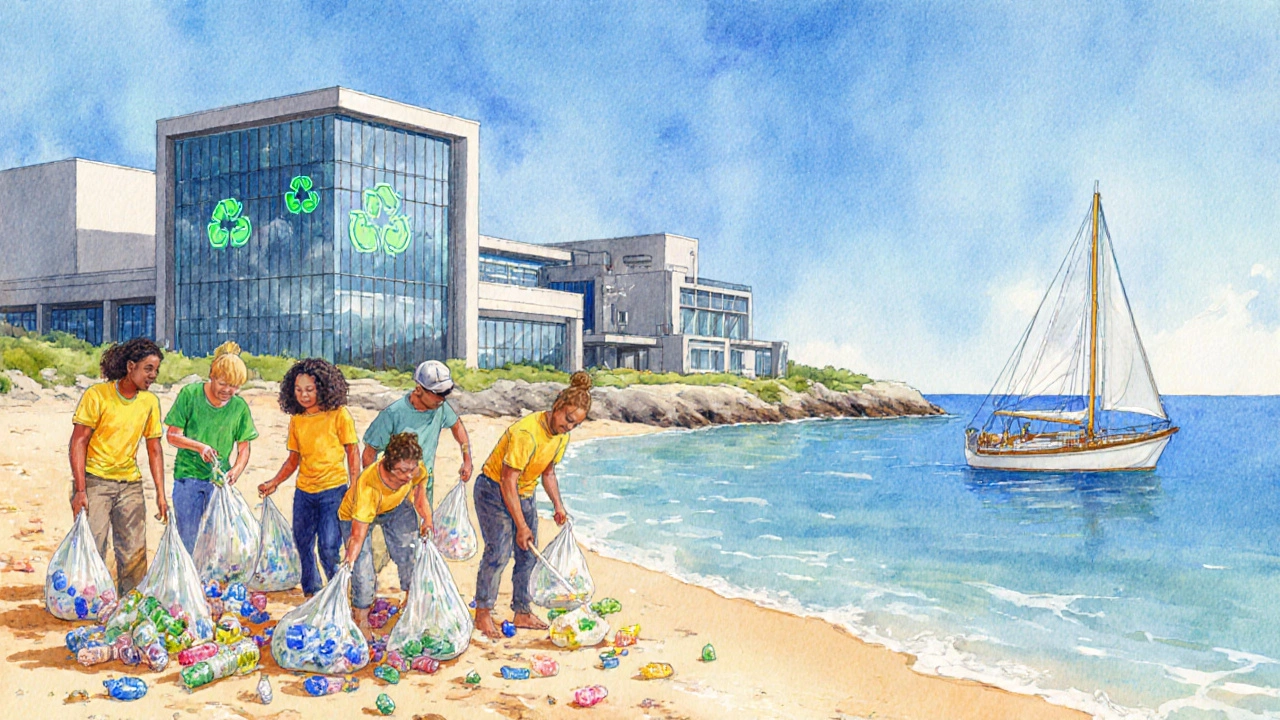
- Participate in local beach clean‑ups; you’ll see first‑hand how much waste is preventable.
- Advocate for municipal EPR programs that make producers fund recycling.
- Choose refillable bottles and bulk buying to cut down single‑use packaging.
- When traveling, avoid single‑use toiletries and opt for solid alternatives.
Future Outlook: Trends Shaping Plastic Waste Management
Three emerging trends could shift the balance:
- Biodegradable polymers: Made from plant‑based feedstocks, they degrade faster under marine conditions, but they still need proper disposal to avoid micro‑plastic formation.
- Advanced recycling technologies: Chemical recycling can break polymers back into monomers, allowing true circularity.
- Global policy alignment: The upcoming UN Plastics Treaty (expected 2025) aims to harmonize standards, set reduction targets, and fund waste‑management infrastructure in low‑income nations.
If these initiatives scale, the volume of plastic reaching the ocean could drop dramatically within the next decade.
Frequently Asked Questions
Which country contributes the most plastic waste to the ocean?
China, followed by Indonesia and the Philippines, consistently ranks at the top due to high production volumes and lower waste‑management coverage.
Do plastic manufacturers have legal obligations to clean up ocean waste?
In many regions, extended‑producer‑responsibility laws require manufacturers to finance collection and recycling, but enforcement varies widely.
How does illegal dumping happen, and why isn’t it stopped?
Often, waste generators pay less to dump in rivers or open land than to transport waste to licensed facilities. Weak monitoring, corruption, and lack of penalties keep the practice alive.
Can biodegradable plastics solve the ocean problem?
Biodegradable plastics break down faster under certain conditions, but in cold, deep ocean environments they may persist for years, so they’re not a silver bullet.
What role does the shipping industry play in ocean plastic?
Lost containers and damaged packaging release thousands of tonnes of plastic annually. Better tracking and stricter cargo sealing can dramatically cut these losses.